Log aggregator Dashboard: AWS Connect and Lex session logs in a common dashboard
Introduction:
Welcome to the Log Dashboard – a powerful tool designed to provide insightful visualizations of your AWS component logs. This dashboard is built using Amazon QuickSight, a business analytics service that enables you to create interactive and share-able dashboards.
In the dynamic landscape of cloud-based communication solutions, AWS resources have emerged as powerful tools that enable businesses to provide seamless customer interactions. However, managing and analyzing logs from these distributed instances can be a daunting task, often leading to inefficiencies and delayed insights. So, it is good to analyze logs generated from distributed sources for a single event. Recognizing this challenge, our dashboard focuses on aggregating AWS Connect and Lex session logs into a unified dashboard, offering a comprehensive view of interactions and events.
The Log Dashboard is designed to help you easily monitor and analyze log data from various AWS components. It provides a visual representation of log trends, log levels, and key metrics to facilitate informed decision-making and troubleshooting.
Workflow:
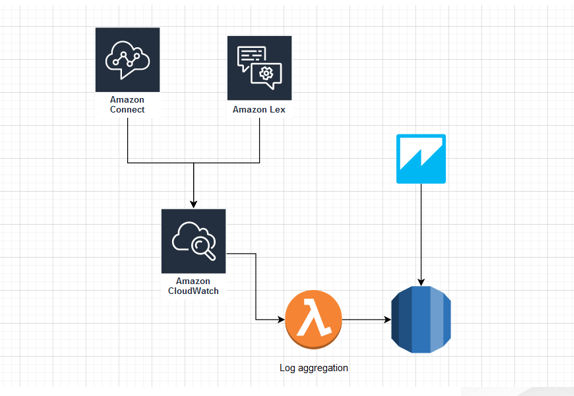
Step 1: CloudWatch Event Configuration
Set up CloudWatch Events to capture logs from both AWS Connect and Lex instances. These events act as triggers for Lambda functions, which are responsible for processing and forwarding the logs to a centralized repository. This ensures that all logs, regardless of their source, are collected in one location.
Step 2: Database Storage
Lambda functions play a crucial role in processing logs received from CloudWatch Events. These functions are designed to extract relevant information and forward it to a central database. This step ensures durability and facilitates easy retrieval of logs for analysis. AWS provides a range of database options, such as Amazon DynamoDB or Amazon RDS, based on the specific requirements. Here we use Amazon DynamoDB.
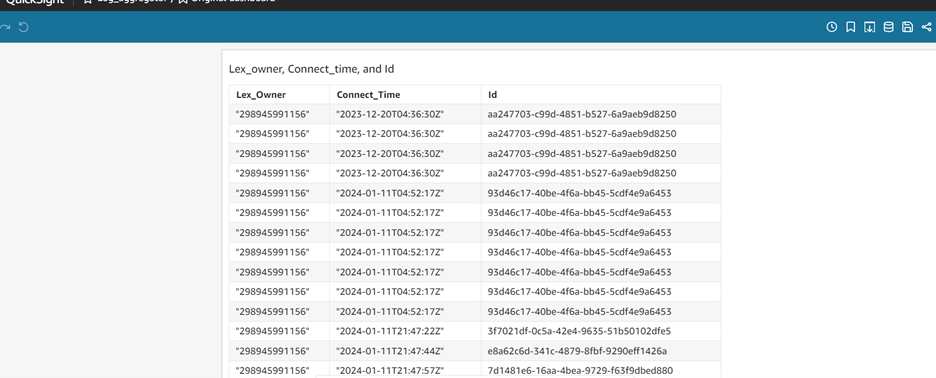
The processed logs are stored in a database, creating a table that contains key fields such as ID, Connect event, and Lex event. This table serves as the foundation for building the unified dashboard in QuickSight.
Step 3: AWS QuickSight Transformation
Amazon QuickSight offers a user-friendly interface for transforming raw data into meaningful insights. Begin by connecting QuickSight to the database containing the processed logs. Once connected, create a dataset by selecting the relevant fields. Required fields are extracted by flattening Json payload.
Next, transform the dataset by applying filters, aggregations, and calculations to derive actionable information. QuickSight’s powerful transformation capabilities allow you to shape the data according to your specific analytical requirements.
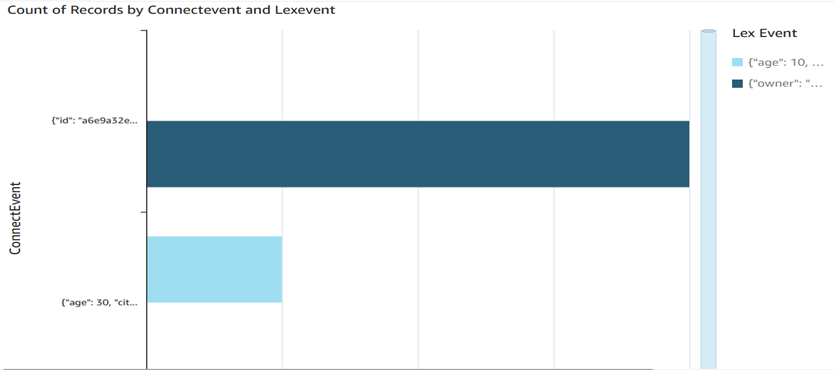
With the transformed data in place, it’s time to build a dashboard that provides a comprehensive view of AWS Connect and Lex logs. QuickSight offers a variety of visualization options, such as tables, charts, and graphs, enabling you to represent data in a visually appealing and easily understandable manner.
Architecture:
Benefits of Using AWS QuickSight:
- No upfront costs for licenses and a low total cost of ownership (TCO).
- Collaborative analytics with no need to install an application.
- Combine a variety of data into one analysis.
- Publish and share your analysis as a dashboard.
- Control features are available in a dashboard.
- No need to manage granular database permissions-dashboard viewers can see only what you share.
Accessing the Dashboard
Login to Amazon QuickSight:
- Visit Amazon QuickSight.
- Log in with your AWS credentials.
Navigate to the Dashboard:
- Click on “Analysis” in the top navigation.
- Select the Log Dashboard analysis.
Explore and Interact:
- Use the interactive elements on the dashboard to explore log data dynamically.
- Hover over visualizations for additional details
Conclusion
In the age of customer-centricity, understanding and optimizing interactions with clients are paramount. The unified dashboard for AWS Connect and Lex session logs addresses the challenges associated with distributed log management, providing organizations with a powerful tool to streamline analysis, troubleshooting, and compliance monitoring. By combining CloudWatch, Lambda, and QuickSight, this project enhances the efficiency and agility of businesses relying on AWS Connect and Lex for their customer communication needs.
The Log Dashboard in Amazon QuickSight empowers you with actionable insights into your AWS component logs. By leveraging interactive visualizations, you can make informed decisions, detect issues early, and optimize the performance of your AWS environment.
Explore the Log Dashboard now and take control of your log data!
